
Beware Selective Measures & Reporting
Part 2
Previously, I highlighted an article that I saw in the March 2013 edition of the Harvard Business Review, “Long CEO Tenure Can Hurt Performance.” In that discussion I challenged the article as an example of selective measures and reporting.
I highlighted my observation of a disconnect between the measures reported in the summary and the striking chart at the bottom of the page that leads a viewer to conclude that the longer a CEO holds their position, the worse the company’s performance.
Today I will challenge the assumptions presented in that single-page report. It may not be a fair fight. I have not seen the entire report, having elected not to spend the $35 they charge for 24 hours of access to it. Clearly, from the comments on HBR’s web site, the authors are not willing to discuss the details of their work; they say in one reply:
“We understand your concern. Unfortunately, the figure here shows only 11 CEOs, but our results are based on rigorous estimation of a large dataset of CEOs in publicly available firms. The full-length article can be found at: XXXXXXX. Our results are generalizable to a majority (if not all) of public firms.”
The chart shows the performance of 11 CEOs, all working for major Fortune 100 companies, from 2000 to 2010. The chart uses the ever-elusive measure of Total Shareholder Return, purely a Theory E frame of reference.
The Trouble with Theory E – Shareholder Return
Theory E focuses on a maximization of shareholder return. Where there are a number of actions a CEO and company can take to increase shareholder return, many factors are beyond the control of the CEO. The amount of shareholder return depends on loose associations of the value of the stock and the performance of the company. Shareholder return also depends on the timing of the ownership of the shares. The broad economic conditions and the animal spirits of the stock market affect shareholder return.
Let’s first visit those loose associations.
The first loose association is the price of the stock and the actual performance of the company. One of the best examples of this disconnect is how Enron’s stock prices held while the company was actually choking to death from a lack of operating cash flow. There are a number of public companies that perform very well, generating piles of operating cash, whom the market does not love. The stock market does not love these companies because investors do not see huge opportunities for price appreciation. That is the reason for some of Warren Buffet’s purchases in the past 10 years, like railroad BNSF. The market did not see growth, but Uncle Warren did. BNSF is now generating piles of operating cash flow, adding to the pile of free cash Berkshire Hathaway can invest.
The second loose association is the actual industry within which the company operates. Some companies are pure plays—they make money from a single business source. The examples to consider are credit card titans, Mastercard and Visa. These companies make money from every swipe of plastic through a register, or every e-commerce purchase. The 2008 farm bill renamed the Food Stamp Program, which is now called the Supplemental Nutrition Assistance Program (SNAP) and converted the program from printed stamps to Electronic Benefit Cards. SNAP purchases route through the credit card transaction systems, and the retailer pays for each transaction. The market trend away from cash and checks to credit and debit cards continues, increasing revenues for the card processors. Investors started to buy up Mastercard and Visa early, and when the stocks took a dive with the rest of the market in Q4 of 2008, investors snapped up more shares.
Market timing has a huge impact on the return of the individual investor. It is also something that a sly analyst can manipulate when reporting the shareholders’ return. Consider Mastercard’s actual share price performance for the past five years. As the green number in the lower right corner of the chart indicates, a stockholder who invested on March 3, 2008 and sold on February 25, 2013 would gain 169%. That is a fantastic return. But wait… if the same shareholder had sold between October 2008 and March 2009, they would have lost 25%.
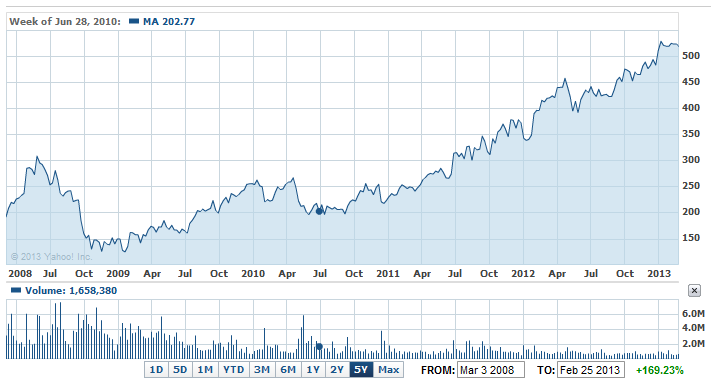
Do you see the blue dot in the Mastercard Chart above? That week Ajay Banga took his place in the CEO’s chair. The reported end of the study is 2010, so Mr. Banga’s impact would be minor. In that short time span the stock price increased 12%. That is not a shabby impact, but it is nothing like the over-50% return that the HBR chart indicates.
If we look at the start date of any of the seven CEOs who have held their jobs for three years or less, we learn that they took their chairs in 2009 or 2010. If the analysis period ended in 2010, then can we really attribute the shareholder returns shown on the HBR chart to those CEOs? Maybe, if you consider the effect a simple change in leadership can have on the price of a stock. The animal spirits of the market can and do drive the price of a stock up or down based on the investors’ perception of the previous CEO, and what they expect the new CEO to do.
The Economic Environment
What happened in October of 2008?
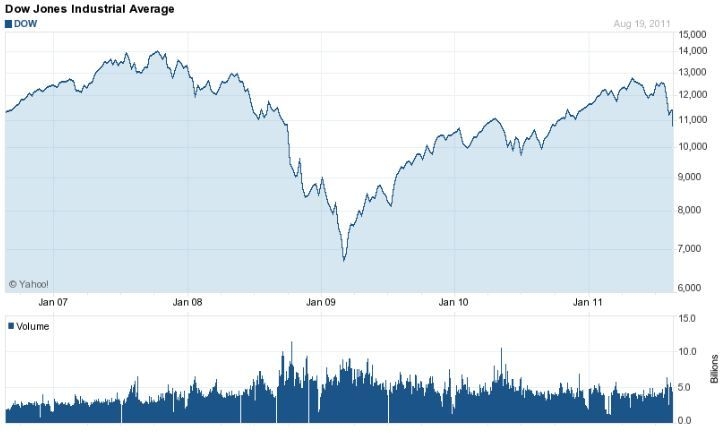
The chart above should be sufficient to remind all of us what happened in 2008. The market crunched with the credit crisis. The US economy was already in a recession. At the low point of March 2, 2009, the DJIA stood at 6,626. As of this writing, it was a busting 14,000.
While the stock market recovered, and investors continued to make gains, the rest of the country suffered. CEOs running large industrial companies faced real challenges as the global economy absorbed credit crisis blows, unemployment, fiscal stimulus, and incredible reductions of personal net wealth. Look at the chart above and ask this question: “Does the stock market even track to the economy?”
If we look again to the HBR chart, we see poor GE CEO Jeff Immelt with a negative shareholder return. If we accept the assertion that Professor Luo’s chart makes, Mr. Immelt has been in the CEO chair too long.
But that assertion ignores external factors. One of the hardest lessons Peter Drucker teaches in his management books is that management has to lead the enterprise through both fair weather and foul, creating more value. According to the HBR chart, Mr. Immelt eroded shareholder value.
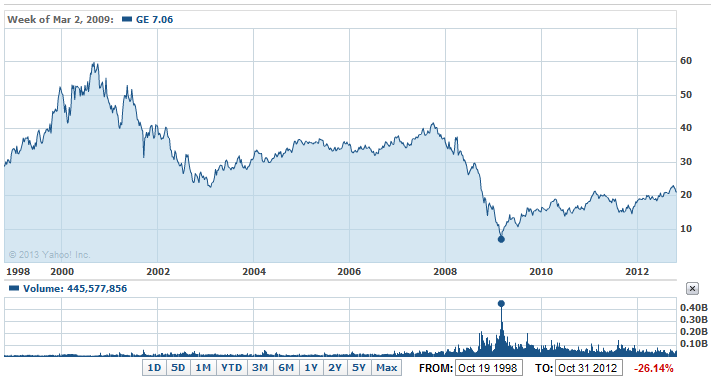
As a stockholder in General Electric who has bought shares a number of times over the past 20 years, I am not happy with the loss on the shares that I purchased in 2003 and 2004 for an average of $28 per share. But I have nothing to complain about with the shares purchased in March of 2009 at about $8.00 per share. And in the time I waited on the shares purchased in 2003, I collected over $7 dollars in dividends. Not a great return, but still not bad. Will GE’s stock price rebound to above $28? I think so. But my investment is just an illustration. If a shareholder bought like I did in the spring of 2009, they saw a 185% gain in the price of the stock.
Let’s consider the external forces that were operating when Jeff Immelt took over the chair from CEO Jack Welsh on September 7, 2001. The market had already discounted GE over 20 points from the time the company announced Welsh’s retirement and Immelt as the replacement. After the 9/11 attacks, GE’s stock price dropped; it started to recover in 2003. That slow improvement ceased at the end of 2007, as the markets started to worry about the credit crisis and the start of the recession. GE not only makes big-ticket industrial objects like generators, jet engines and railroad locomotive, it makes big-ticket consumer durables like appliances, and it made money off the credit from the sale of everything it made. When the recession hit, demand for all things GE dropped like a stone, and so did the cash flow from the credit stream.
If we look at the right side of the HBR chart, all the CEOs with more than five years of tenure battled through the same economy. Comparing the guys on the left side of the chart to the guys on the right of the chart is pointless.
Professor Luo asserts that the longer the CEO is in the chair, the worse their performance. The chart makes his point, and his article kicks off with the same assertion.
“It’s a familiar cycle: A CEO takes office, begins gaining knowledge and experience, and is soon launching initiatives that boost the bottom line. Fast-forward a decade, and the same executive is risk-averse and slow to adapt to change—and the company’s performance is on the decline.”
The Reasons for Change
In light of the Theory E vs. Theory O arguments illustrated in my other articles, let’s consider the mission of the CEO. The mission varies according to the unique needs and structure of each organization, but I think we can agree on the following key mission goals:
- ⦁ Lead the creation, communication, and implementation of the enterprise’s doctrine (vision, mission and direction) and strategy.
- ⦁ Lead and oversee the operational performance of the enterprise.
- ⦁ Represent the enterprise in economic, civic, professional, and political activities.
Companies change CEOs for three main reasons:
- ⦁ It is simply a succession plan, and as one retires the next is promoted. That was the case at General Electric when Jeff Immelt succeeded Jack Welsh. The CEO and the board select someone to carry on, following the current doctrine and strategy.
- ⦁ The CEO leaves for greener pastures, or leaves because of health reasons. These departures are sometimes a surprise, and sometimes not. Apple went through this transition, but I can make the argument that the Apple transition is really an example of the first reason. More often than not, this kind of CEO change is an unplanned event. If the CEO leaves, you can make the assertion that the CEO exited before the board asked them to exit.
- ⦁ The CEO screws up and the board must kick them out. The CEO revolving door at HP is an example of this. The reasons can be company performance, as with Carly Fiorina and Leo Apotheker, or personal behavior, as with Mark Hurd.
Some companies follow a doctrine of planned replacement, where the CEO’s tenure is contractual and the CEO should expect to move on after five years. Some companies, like Microsoft and Apple, have no doctrine and make changes as demanded by the market, or by the whims of the CEO (with the approval of the board). When the CEO controls the board, as is the case with many privately held companies, the CEO goes only when the CEO wants to go.
Professor Luo suggests that CEOs stop learning when they attain their positions.
“The underlying reasons for the pattern, we believe, have to do with how CEOs learn. Previous research has shown that different learning styles prevail at different stages of the CEO life cycle. Early on, when new executives are getting up to speed, they seek information in diverse ways, turning to both external and internal company sources. This deepens their relationships with customers and employees alike.”
To make a final point stick, let’s examine a hard measurement of business success, the Operating Cash Flow (OCF) of the enterprise.
Fiscal Year (last three years) General Electric Mastercard
2009/10 Operating Cash Flow $24.42 Billion $1.70 Billion
2009/10 Net Income $11.03 Billion $1.85 Billion
2011/12 Operating Cash Flow $33.36 Billion $2.95 Billion
2011/12 Net Income $14.15 Billion $2.76 Billion
If we look at the performance of these two companies, the disparity in cash generation stands out. In 2009 GE created 5.9 X the Net Income of Mastercard and 14.4 X the OCF. In 2011 GE created 5.1 X the Net Income of Mastercard, and 11.3 X the OCF.
Operating Cash Flow is all of the money the enterprise makes in the operations of the business. Note that GE’s 2009 OCF is 2.21 X their Net Income, while Mastercard’s is only 1.08 X. In the next two years GE, under the leadership of Jeff Immelt, increased the OCF/net income ratio to 2.35, while Mastercard under Mr. Banga fell back to a 1.07 ratio.
In Professor Luo’s opinion, “As CEOs accumulate knowledge and become entrenched, they rely more on their internal networks for information, growing less attuned to market conditions. And because they have more invested in the firm, they favor avoiding losses over pursuing gains. Their attachment to the status quo makes them less responsive to vacillating consumer preferences.”
I think the numbers fail to support that theory. How about you?
Articles in This Series

Call Us! 877-674-7495 info@dksco1.com