
Variability of Demand
Most retailers fear out-of-stocks. “You can’t sell it if you don’t have it,” is an inventory management mantra chanted in the planning departments of many retailers. Stockouts not only drive retail planners to diversion.
Manufacturing production planners quake with fear at the thought of a production line stopping because a critical part is out of stock. To minimize the risk, inventory managers take measures to provide insurance, building up additional inventory — safety stock — to account for the variability of the real world. Safety stock represents captured working capital, unproductive capital trapped to provide nothing more than insurance against running out of stock.
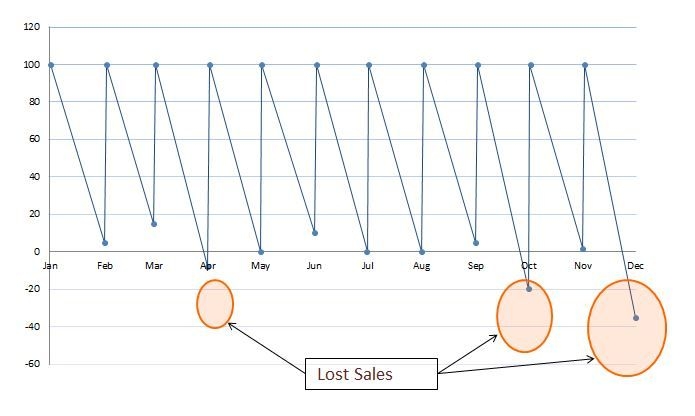
Lost Sales
If you talk about safety stock to most inventory planners, they think of lost sales, or unfulfilled demand. In the old days of retail, managers automatically thought of out-of-stocks as lost sales, applying the average sales trend to the number of days the product was out of stock. There is a problem with that methodology — it assumes that people actually wanted to buy the product at the same average rate. This may be a good assumption for a high-volume commodity like gasoline or milk, but it is perhaps a bit wrong if you are talking about size XXXL Washington Redskins jerseys in June.
E-commerce now sharpens the point on the spear of lost sales. In the old brick-and-mortar days before e-commerce, a customer who really wanted an out-of-stock item might come to the customer service counter and ask for a rain check. Today, that customer whips out their smartphone, finds the item online, and either goes to another store that has the item or orders it online. The first store never even knows they lost the sale.
With an online store, we can tell if a customer looked at an item, but we can’t tell if they wanted the item; they may have been price shopping. The only sure way to know if it was a lost sale is if the customer leaves a “tell me when it’s back in stock” message. We can study customers’ behavior to learn how many will go to another site to buy an item if it is out of stock on our site. The odds are high that most of them will. It depends on the item, its ready availability elsewhere, and the prices of the alternatives.
Substitutions
Taking the lost sales issue just one step farther, does the lost sale of a specific item mean that the customer goes to another store? Not always. The customer may choose another item on the shelf, or another item on the site, an item that potentially makes us more margin dollars.
Substitutions happen in manufacturing, but the options are more limited. Using a 7/8" long bolt in place of the specified 13/16" long bolt may not always be a problem, but in some cases it can cause a tragedy. Substitutions happen all the time in wholesale food service, where a higher-priced burger, fish, or sauce is shipped at a lower price.
Does a substitution mean that the customer is unhappy? Not always. I know of some restaurant operators who carefully order a lesser product, knowing they are one of a few customers that use it, and knowing that the distributor will automatically substitute the better product at a cheaper cost. In this case, the substitution is the desired outcome, and they are happy.
Methods
In my retail days, we talked about things like OSWO (Oh Shit, We’re Out), FISH (First In, Still Here) and JIC (Just in Case) inventory methods. These really were not methods as much as they were the conditions we struggled to avoid. We built models of various levels of sophistication in attempts to optimize inventory, increase turns, and reduce safety stock. Over the past three decades, retailers and manufacturers have continued to develop better methods and create better algorithms to improve inventory performance.
Yet inventory planners still worry about OSWO, and so they build inventory insurance with safety stock. They have to. No amount of modeling can anticipate the variance in actual execution. Mother Nature hates supply chains, as she demonstrates with flooding and earthquakes. Supply chains depend on activity execution in every link, links where failure is a real possibility and variance is a high probability. Supply chains feed consumption, and that consumption inherently varies according to the whims of consumers.
Safety stock happens. It happens for a reason. That reason is variability.
Isolation and Remedy
What are the key components of any inventory management program?
- Forecasting
- Policy
- Resources
- Lead time
- Execution
Examine each of these components and you will find variability. Improving optimization requires removing the variability. But it is very difficult to remove all variability, and with increased difficulty comes increased effort and cost.
Forecasting Error
Forecasting demand is the first step in the process. It involves learning how to predict the needs of the consumer. Demand is rarely stable. Predicting demand requires a multi-variable model that looks at tens, hundreds, even thousands of variables. No matter the ability of a computer to calculate or the ability of developers to create clever new algorithms, new variables appear, variables that always existed but were invisible behind the noise.
Therefore, forecasting error is a given. To combat that given, managers develop policy.
Policy
The key inventory policy is service level. Simply defined, service level is the percent of time management wants to have a product in stock. We don’t ever want to be out of stock, but it is too expensive to be 100% in stock. Expensive and impossible.
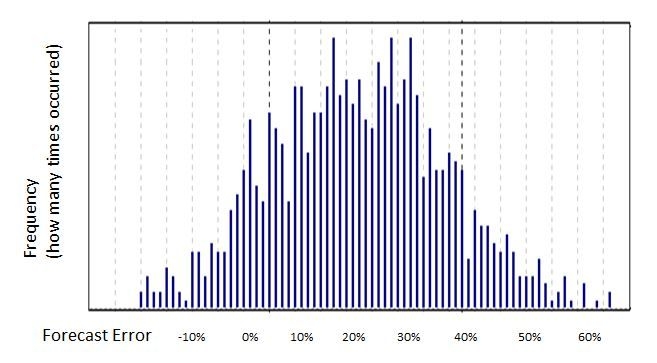
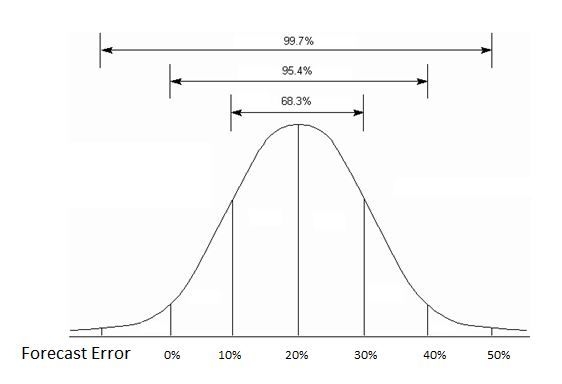
Consider the forecast error chart above. The actual instances of error correspond to specific percentages, averaging around a 20% error in forecast. If we take the results and apply them to a statistical distribution curve, as shown to the right, we see that forecast error falls between 0% and 40% error about 95.4% of the time. If we carry enough safety stock to correct for these errors, we will be at risk of being out of stock 4.6% of the time.
Risk is not assured, meaning that a 95% service level does not mean that we will be out of stock 5% of the time, only at risk. Notice in our curve that the line never closes with the base of the X axis.
There is something strange about this data. Notice the data points indicating negative forecast error? Isn’t zero the lowest error score we can have — that is, zero defects? You can’t have negative defects, can you? In any statistical analysis we will find errors in the data. Data entry mistakes are the most common cause, as are false positive and false negative errors.
Let’s assume executive management declares that a 95% service level is insufficient, and they want to be out of stock only 2% of the time. At our 95% service level we carry an additional 40% of inventory. Now they want 98%. Looking at the chart, adding 50% of safety stock gives us +99%. Except that the 99% line stretches over to that negative error area. We have to move the start of the 99% line to “zero” and then find out how much additional safety stock we need. We have to redraw the chart, which is below.
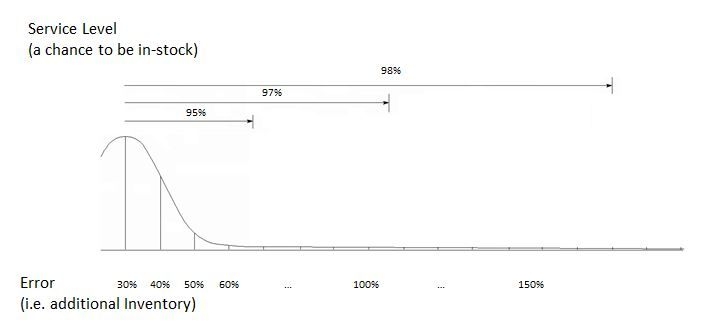
When we adjust for the negative error data, our average changes. The average error rate grows from 20% to 30%. Our 95% service level isn’t 40% of additional anymore; we must now have about 70% additional stock. To provide a 98% service level we will need 170% additional inventory as safety stock!
Service level policy is just one of many policies that move, often on a whim and without proper analysis. In this case, because of the high rate of forecast error, two points of service level change adds over 100% of additional inventory. That is why inventory policy must address margin contribution and the importance of the item to a core customer’s shopping basket. Grocery stores drive very high service levels to milk, eggs, and other staple products for which there is no substitution; a customer will abandon a cart in the aisle if there is no milk. That same customer may not think twice about using a different cut of meat.
Resources
It is clear that fixing forecast accuracy is important. That is why so many inventory managers want better forecast tools. These managers want better resources, smarter people, and better tools to combat the forecast error issue. There is a limit to what a system can provide if the demand signal data is limited to what the company sold, because true demand is not knowable if the item ever runs out of stock.
Additional safety stock improves the accuracy of the demand signal sourced from the POS data. If the item is in stock, the demand is what we sold. Except that does not tell us what the demand could be if we changed the pricing or promoted the product, or if a competitor dropped their price for a similar item.
This is where predictive analytics helps improve the odds of reducing forecast error. Using some additional demand signals, and that better forecasting tool, helps move the needle.
Articles in This Series


Call Us! 877-674-7495 info@dksco1.com