
Capacity
 How much extra capacity do you have? Well, that depends.
We sometimes hear that truck capacity is tight — meaning it is hard to get trucks to haul loads. I think for the most part, capacity is tight. There may be enough total capacity to cover the total demand for trucks on a national level, but getting trucks in specific markets to go to other specific markets can be difficult, depending on the load, the lane, and the day of the week. Brokers I know tell me they value their carrier relationships more than their relationships with their shippers because the carrier capacity is so tight.
We can overlook the question of capacity in so many ways. Novice shippers think that there is sufficient capacity. Perhaps it is sufficient if you are paying a high enough price to lock the capacity in. Even so, when demand outstrips supply, lack of capacity has a way of jacking prices up.
Let’s flip that question for a moment. If a lack of capacity can drive costs up when demand is greater than supply, does reversing the flow also drive prices up? What if supply is much higher than demand, but the capacity is still tight; will prices increase? Simple supply and demand rules tell us:
Supply > Demand = Lower Prices
Demand > Supply = Higher Prices
My question is more complex. I am adding in the idea that there is a capacity constraint between the supply and demand points, like this:
Supply > Transport Capacity < Demand
Here the demand is less than the supply, but greater than transport capacity.
What happens to prices when that happens?
I asked some of these questions in 2014, when I wrote about a projected bumper corn crop.
- • At harvest, what does the farmer do with the extra corn?
- • Do they have the storage for a double-sized harvest?
- • Is there sufficient transportation capacity to move the grain from farm to elevator?
- • Is there sufficient elevator capacity?
- • Trains move most of the corn beyond the elevators; what kind of pressure does this put on rail networks?
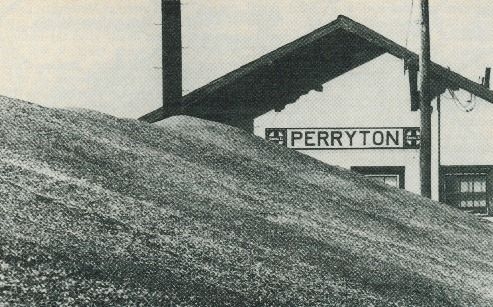
This is not the first time I had written about the challenges of rail infrastructure capacity here at WATP. Back in September 2012, in the wake of that summer’s drought, I wrote "Railcar Shortages Highlight a History of Problems." In that article, I discussed what happened with the wheat bumper crop in 1979, when the rail network lacked the car capacity to move the wheat from the fields to the markets.
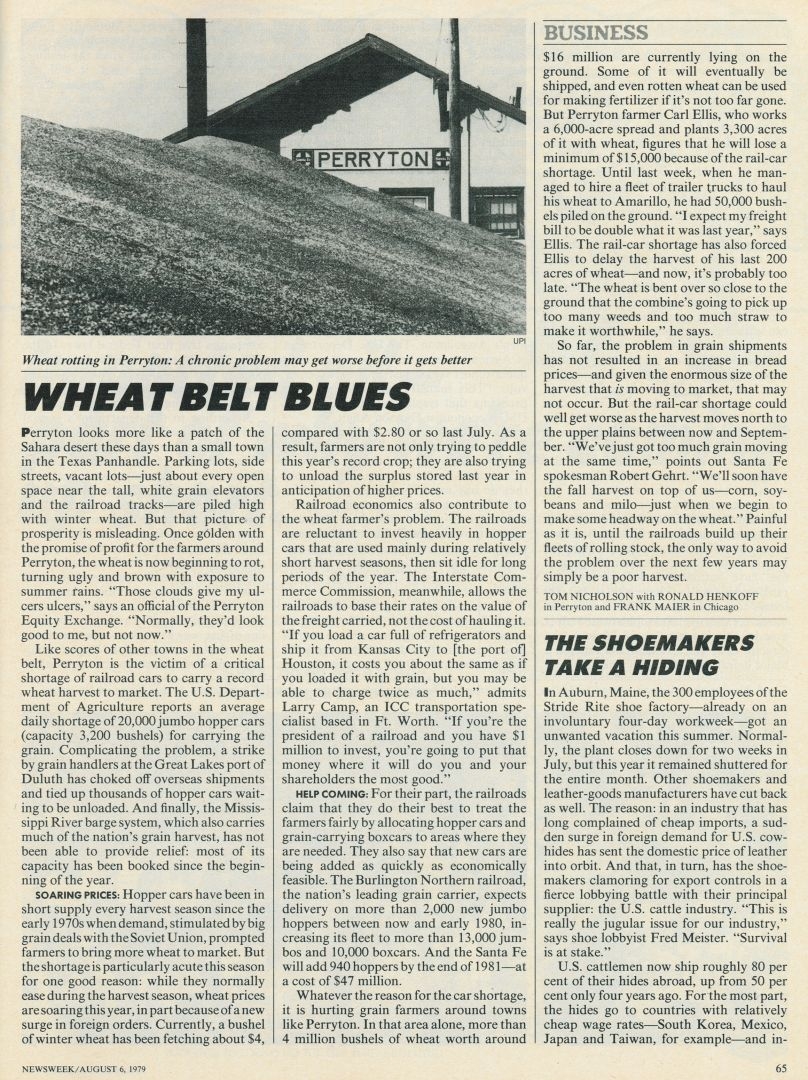
Because of the broad demand for corn, the corn market is bigger than the wheat market. In 2010, the corn market was almost five times the size of the wheat market. Corn, in the form of flour or corn syrup, goes into just about every manufactured food product. The federally mandated 10 percent ethanol in our gasoline comes from corn. The wheat markets did not see much damage to the supply in 1979 because of the abundance of the crop. It was a bumper crop year, and much of the wheat left to rot was excess. In a simple supply/demand equation, the abundant harvest should have lowered the price for the grain. But the historical price charts tell a different story, as the life contracts for wheat climbed in June 1979 from 362 up to 475 per bushel. The higher price remained, dropping to 400 in August 1979 before returning to the 475 range by the end of the year.
(Note: the prices here are in cents per bushel, so 400 per is $4.00 per.)
The market benefited from big grain deals with the Soviet Union throughout the 1970s. The drop in rail capacity may have helped the market maintain its above-400 pricing by keeping grain off the market.
Could the same thing that happened to the 1979 wheat market happen in the corn market of 2014? Perhaps. Commodity pricing is more than just the simple balance between supply and demand. We use corn in many, many foods, and we use it to feed livestock that turns into the animal-based proteins we eat. Our farms export 20 percent of their crops overseas as feed, in addition to other corn-based exports. If there are disruptions in the flow of corn from field to processor, would the resorting shortages prop the price of corn back up?
In 2012, the Chicago Board of Trade (CBOT) history shows corn trading in the low 500s until July, when the price climbed up into the 800s. A drought struck the US in June and July, with early heatwaves and punishing dry winds. The corn crop dropped by over 13 percent, and the harvest was 1.6 billion bushels less than the year before. The crop recovered in 2013, but prices were higher until the harvest came in, and prices dropped to under 400 in July 2014. With the price around 350 per bushel, the market was showing a lack of concern about the capacity of the rail network.
What Kind of Capacity?
The problem in 1979 was a lack of covered hopper cars. I didn’t think that was going to be a problem in 2014. Between private owners and the railroads, there were almost 500,000 covered hopper cars in the North American rail network. The problem in the past was not hopper car capacity, but a lack of enough locomotives and crews to spot the empty cars and pull the loaded trains.
On my travels through Iowa, I saw two locations on the CP Rail lines (old Soo Line tracks) where hundreds of empty covered hopper grain cars sat, waiting for the corn harvest to come in. According to other reports, there are similar strings of waiting hopper cars throughout the rail system in the Corn Belt. Getting the cars in place for filling and then moving them out to consolidation yards may not be as much of a problem as getting the cars moved in the limited mainline capacity. Carloadings are up across the board for all the railroads, with intermodal, steel, and crude oil trains adding to the load.
No, the problem in the transportation network is not the cars, but the lack of line capacity to move the cars to destinations. The longer a car sits loaded, the less time it has to get back to an origin point for a refill. With a 2014 harvest projected at 14.5 billion bushels, the railroads may have needed to turn the hopper cars a few times to accommodate movement. Not all of the 500,000 covered hoppers in the network are for grain service; many carry plastic resin, frack sand, and fertilizer. At about 4,100 bushels per rail car, a 14.5 billion bushel corn crop equals over 3.5 million carloads.
The key to managing the flow is the grain storage in the total network. Starting at the farms, more farmers built grain storage bins to help hedge the timing of their grain sales. A farmer with ample storage can put his harvest into storage on his own property and time the release of the crop when prices recover to ensure a profit. In fact, a good portion of the harvest will not leave the farms. Rather, it will be used by the same farms where it is grown, or sold locally to other farms, becoming feed for cattle, chickens, and pigs.
We did not know the outcome of the corn harvest until that fall. What do you think happened?
Articles in This Series


Call Us! 877-674-7495 info@dksco1.com