
Big Data:
Predictive Analytics
Are you tired of hearing the term, big data? How tired are you of hearing the term, predictive analytics?
Big data I am very tired of hearing about. But predictive analytics? I think I could spend hours talking about that subject.
 If you are one our longtime readers, you know we've written many articles about big data over the past few years. If your memory is good, you will remember that I think the concept is somewhat like bad buttermilk biscuits — hard and inedible. Like the ingredients that go into biscuits, data is just data. We can get data from anywhere. More data does not mean we get better answers; it just is more data. Better answers are the result of better questions!
I will not rehash my thinking on big data in this article. If you're interested, I've posted a list of links at the bottom of this article that will lead you to my articles on the subject. I do encourage you to read them. I also gave a presentation at the fall 2013 Retail Value Chain Federation meeting in which I talked about big data, and the discoveries we made working with a client. Don’t worry — the content focuses more on the practical use of data than on the technical issues. So read those articles to acquire a deeper understanding of my summary about big data.
Can Big Data Deliver?
One of the key features of Big Data is the wide variety of unstructured data that is now available in the cloud. To marketers, the ability to mine Facebook, Twitter, Google, (and just about any other web-based platform) for data about consumers' individual habits, patterns, and buying decisions is like the El Dorado gold mine. They believe there must be great value in that data. The problem is figuring out what all that data really means.
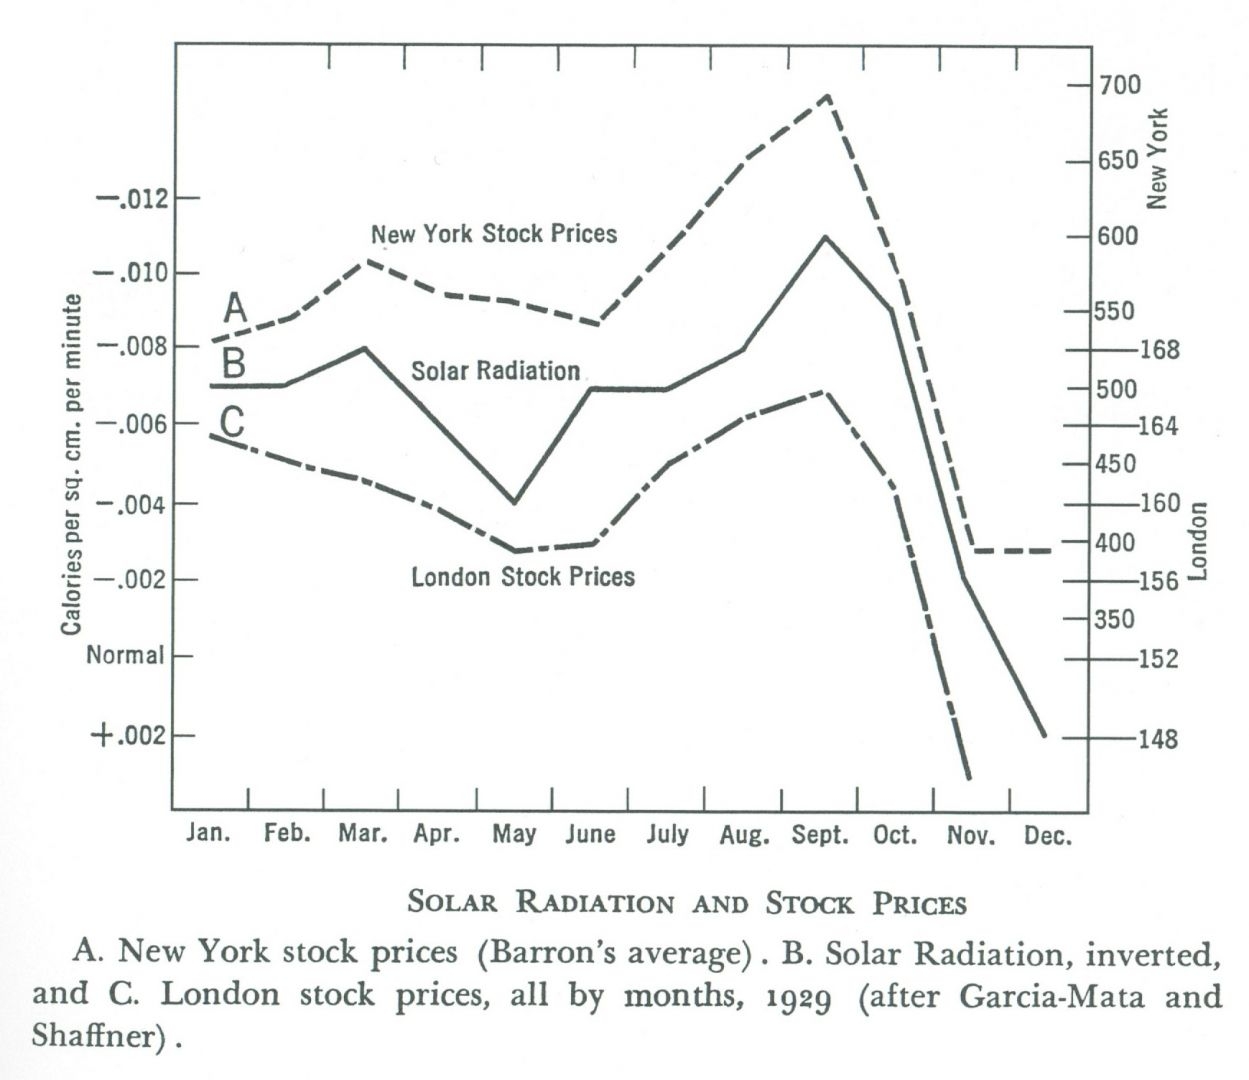
Correlation does not indicate causation. Just because two different data sets appear to track together does not mean that one set of events causes another set of events to happen. One of my favorite examples of this is this chart I found years ago of stock prices in 1929 and solar radiation levels. It appears that the sun's radiation influenced stock prices. But there is no proof that the sun’s radiation in fact caused these changes.
I don’t know how many times people have presented me pictures like this, claiming that the correlation was causation. Our world is far more complex than we sometimes appreciate. Sometimes different data tracks not because one is the result of another, but because some other event is the cause of the variation in both sets.
A Predictive Analysis of Predictive Analytics
Predictive analytics is the purported Holy Grail of big data. The idea goes like this:
With enough data from enough sources, we can analyze the data for patterns that lead to specific outcomes.
I don’t dispute this logic, but I would modify the theory just a bit.
With enough relevant data from sources that are sufficient, consistent, and accurate, we can analyze the data for patterns of behavior to determine causation. Once we understand the causation, we have a better chance of predicting specific outcomes.
Accurate predictions of outcomes in simple closed systems can be difficult. Imagine a simple light circuit — nothing more than a battery, a switch, the bulb, and the wires that connect the light to the switch and the battery. Hook up the leads, close the switch, and the bulb lights. Predictable, right? It is … until the bulb stops lighting. How many things can go wrong?
- ⦁ The battery loses charge.
- ⦁ The switch breaks
- ⦁ The wires break.
- ⦁ Nobody throws the switch.
- ⦁ The bulb burns out.
Of the five reasons above, which is the most likely to happen? Without any tracking data, you don’t know. Without enough observations, without any data, we can’t predict the likelihood of any of these failure points. But we can make reasonable assumptions about the potential root cause of each failure. Hours of activity are potential causes of failure for #1 and #2; the longer the light burns the more it wears, and the more the battery loses charge. The more the switch cycles on and off, the more likely it is to fail, and the more likely the bulb is to fail.
What could be the root cause for the wires breaking? If the components can move, the wires could come lose or break. If the wires are too small to carry the current, they can burn out. We can take measures to reduce the risk of failure by fastening all the components so they don’t move, and by using the right gauge of wire.
The last of the failures requires more information. Who throws the switch? Why do they throw the switch? What can prevent them from throwing the switch? Can we measure any of these factors? What data can we use to help us predict the likelihood of failure? The answer is not in any collectable data, because there are complex reasons outside of the system that could lead to failure of this one component. To build an understanding we have to ask questions, make observations, and measure.
Logical thinking about the root causes of failure leads us to the data that we should observe and measure until there is a system failure. Thinking through the failure points also uncovers the more complex components, the parts where pure data collection and analysis cannot provide predictive data.
The Crux of the Biscuit
Have you ever baked simple buttermilk biscuits? They are easy to make, but hard to perfect. If you look at any number of cookbooks, there is not much difference in ingredients or instructions. Some recipes call for five ingredients (all-purpose flour, unsalted butter, salt, baking powder, buttermilk), some add baking soda for good measure. Temperatures and cooking times vary. Still, by following the directions it should be easy to make a nice fluffy batch.
If you have made buttermilk biscuits, you know that just following the directions in the cookbook is not enough. It takes a great deal of practice, and a combination of knowledge and skill, to perfect the process. There is a secret to the perfect biscuit. There is science — the reasons why you work with very cold ingredients, why you leave the butter in chunks the size of peas, and why you have to be careful not to overwork the dough. Forget any of these, and you get golden hockey pucks of hard, baked flour.
The three-minute video that follows will show you how to make buttermilk biscuits. Do you think you can make a perfect batch from just watching the video?
Why am I talking about biscuits in an article about the growing trend of predictive analytics?
The key to making good biscuits is how you put the dough together, not the ingredients. The key to solid predictive analytics is how you put the data together, not what data you use. Of course you can’t make biscuits if you don’t have flour. Leave out any of the ingredients and the biscuits will not be right. Likewise, if you fail to include all the relevant data, your predictive analysis is flawed. But just like with making biscuits, if you don’t apply the right skills and practice to your analytical effort, you get results that don’t achieve the outcome you are looking for.
The real trend to watch with predictive analytics is not the increasing universe of available data, or the tools that we can use to crunch ever-increasing piles of data together. The trend to watch is the growing skill of the people actually creating the analysis. If we watch the enterprises that best deploy predictive analytics, we see that they invest in the people who run the process, perhaps more than they invest in the tools or the gathering of the data.
It’s not the recipe that makes the better biscuit; it is the cook.
Articles in This Series

Call Us! 877-674-7495 info@dksco1.com