
“You can’t manage if you don’t measure.”
I remember that statement from one of my very first classes on management and supervision. Any of us that started in the warehousing industry understand our metrics and measurements. Logistics runs on measurements – the numbers – and the metrics. So does every other form of business.
In my very first distribution management position, I started a whole set of measurement and metrics for the warehouse. We started tracking production numbers manually, from the summary reports we got out of the WMS system, entering the data into a spreadsheet that I ran on a Commodore 64 personal computer. Charts went up in the break room, graphing productivity, orders processed, orders received, cartons shipped, line shipped, manhours per order, manhours per receipt. Within 90 days we had at least 15 different metrics to measure our progress for change. Then we started to track productivity by individual, implementing a Reasonable Expectancy program where the associates tracked their production. That created even more data to enter into the C64 computer.
It wasn’t long after that we started to measure our storage capacity, and how well we utilized that capacity. We replaced gut-feel of our capacity and how full the DC was with hard numbers that showed the building capacity and how full it was. Because of that effort to measure capacity, we discovered pools of wasted space created by poor storage rack layouts. Looking at the layouts led to recognizing storage locations where we never used even half of the actual space available.
All of the measuring led to changes. The time spent gathering the data and entering it into the computer gave me a chance to see it every day, to compare the numbers with the activity that I watched happen that day. The data collection and entry effort was tremendous; I found myself working three or more hours every day after the warehouse closed, working the data and examining what our opportunities were.
In working the data, I discovered the relationships between different conditions in the warehouse, conditions hidden in the stacks of inventory that we could not see before we collected the data. It wasn’t even a month after we started tracking our capacity that I figured out that when our utilized storage capacity passed 80%, our overall productivity started to drop. Yes, the forklift moves per hour were up, but that reflected all the pallet moves the team made to consolidate space. While the fork drivers were busy making space, they were not stowing as much inbound volume or making replenishment moves. Receiving backed up because cargo didn’t move off the docks. Picking and shipping suffered from slower replenishment.
Before long, I started to present plans to my boss. The collection of the data, and the reporting helped illustrate to him, and others, what our missed opportunities were. We made big changes in the operations that increased our storage, adding over 40% more available cube in the building by altering our layout and moving where we stored different products. We changed the stowage process so that goods moved off the dock faster, and so that the lift drivers did not drive as far to make replenishments. We more than doubled our throughput while adding only one person to our headcount.
Without measurements, we would not have made these changes.
The articles and stories in this topic address the art of operation measurement. I call it an art because it is not yet a science. Measurement is dependent on what the managers see as the need. If they feel pressure to improve productivity, they will measure productivity, sometimes making progress. Knowing first what to measure and how to measure it takes wisdom and experience. Getting past the Hawthorn Effect, where the productivity of an activity improves just from the act of measuring the activity, and being able to get to the real productivity drivers is a learning experience. You can attempt to learn it all on your own, or you can use what we have here to gain the wisdom to choose the right measurements.
Articles in This Series
Articles in This Series

Beware Selective Measures & Reporting Part 1
“Long CEO Tenure Can Hurt Performance,” announced the headline in the March 2013 issue of the Harvard Business Review. University of Texas professor Xueming Luo and a pair of PhD candidates authored the short article following that headline. The article is simply a brief summary of the findings of a study of 356 U.S. companies from 2000 through 2010 to determine the impact of the CEO’s tenure on the performance of the enterprise. Read More
Beware Selective Measures & Reporting Part 2
Previously, I highlighted an article that I saw in the March 2013 edition of the Harvard Business Review, “Long CEO Tenure Can Hurt Performance.” In that post I challenged the article as an example of Selective Measures and Reporting. Read More
Create Measurement Alignment Across the Operation
One of the key benefits of taking measurements is using them to motivate workers to want to do their best work rather than doing just enough to get by. This results in higher performance goals and broader vision. Read More
KPI Metrics An Ongoing Discussion
I have been active on LinkedIn since early 2007, when an old boss “invited” me to join his network. I soon discovered the "Answers" section, where people would post questions and other users would supply answers. Read More

Submarine Sandwiches, Heroes & Debt
The Quiznos sandwich chain has announced that the company continues to struggle with a sales slump. More frightening is Quiznos' $850 million debt-load. Read More

Choosing the Right Measurements Is a Matter of Context
Business is an intellectual sport. Every sport has a scorecard, and a vocabulary that is specific to the sport. If you can't read the scoreboard you can't tell who is winning or losing. Read More

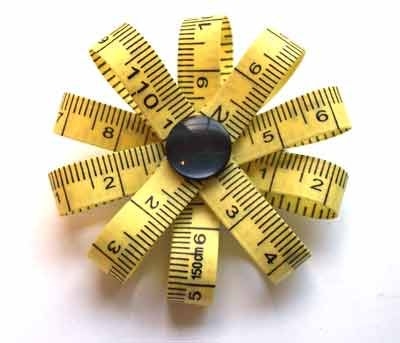
Measurements… What Should We Measure?
I was having a conversation with a young artist this morning, a lovely young lady who makes jewelry. She wants to start her own business. She thinks she should take some business courses before she graduates from college. Read More

Oh - the Shrinking Cash Flow!
On the surface, things looked great: As of June 30, 2011, Groupon had $225 million of cash. Despite losing $103 million in Q2, moreover, the company actually generated about $25 million of free cash flow in the quarter. Read More

Defending OCF as the One Best Supply Chain Metric
That is the opening salvo in the column I wrote for the August 8, 2012 Supply Chain Digest entitled, “The One Best Supply Chain Metric.” The article appeared in editor Dan Gilmore’s weekly First Thoughtcolumn, a space that Dan does not give away freely. Read More
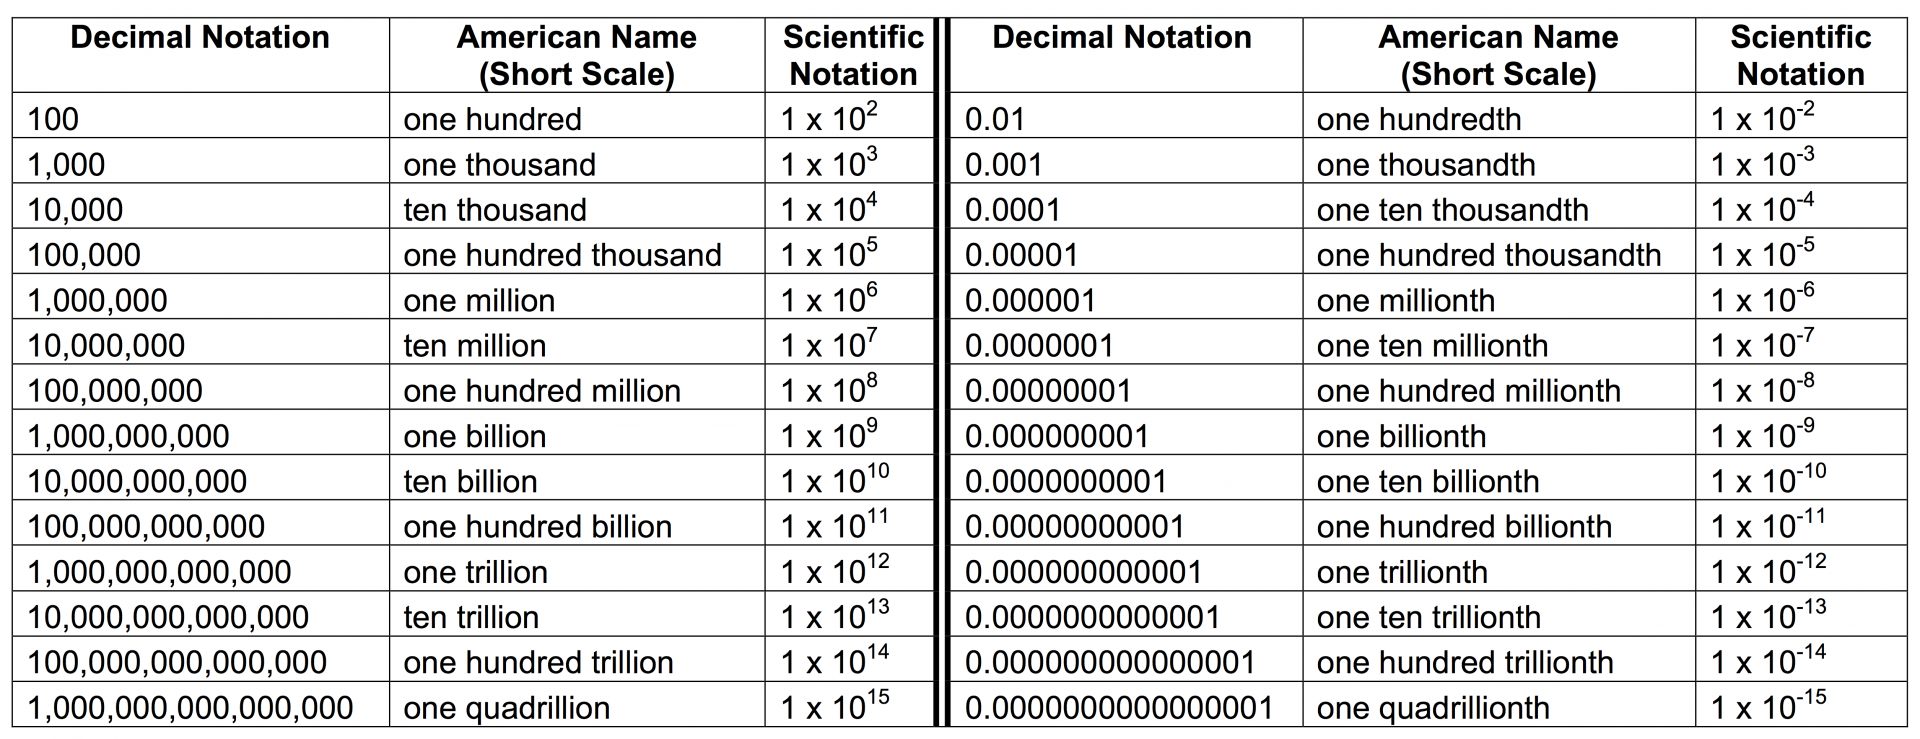
Using the Small Numbers
A few months ago, I discussed opportunities to improve cash flow with a potential client. This procurement officer really wanted to make a name for herself, so she wanted to create a project that would produce some eye-popping results (her words). Read More
Bluster, Noise & Delay Groupon's IPO
In this article, I use the internet marketing discount coupon site, Groupon, (see: Oh – the Shrinking Cashflow!) to illustrate an example of working capital deficit. Below are the reasons why I chose that company as the case example for this article. Read More

Call Us! 877-674-7495 info@dksco1.com